

Dominant bias for ETHEREUM (ETH)- Bearish
Resistance Levels- $220, $250, $280.00
Support Levels- $150, $130, $110
ETH is in a bearish trend. The bullish pressure from the formation of an inverted hammer formation on 23rd October at $203.55 was weakened at $208.00 in the resistance area. Rejection to upward continuation occurred at the downward trend. The formation of the bearish spinning top return the bears at $207.10. $205.14 was the low the bears dropped ETH before the end of the session. The 4 hour opening at $205.25 keeps the bears in control with ETH down to in the support area.
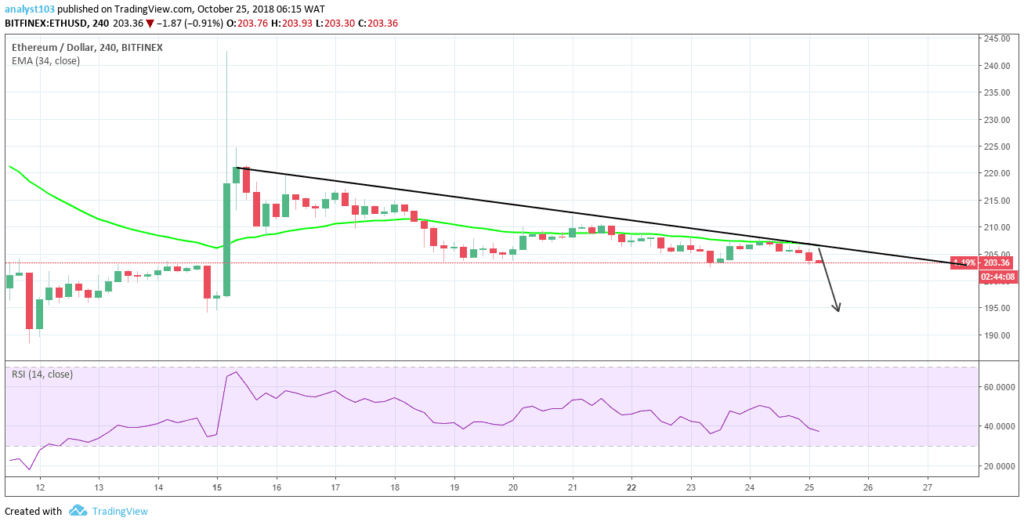
A bounce is expected at the downward trendline any time soon. This is due to the previous occurrence and current exhaustion of the candles denoted by wicks around the line. Moreover, the price is below the 34 exponential moving average an indication of the Bears’ pressure.
The relative strength index is at 38% which is the sellers’ zone and its signals point down. This suggests a further downward movement in the cryptocurrency due to the bear’s pressure.


