

The Bakkt Future Contract services for Bitcoin is finally live, and all the guesses and claims by the crypto traders and investors have been proved wrong. People expected the price of Bitcoin to rise as the new service will start with a huge amount of trades, but things didn’t turn out how they expected them to be.
Bakkt Bitcoin Future traded 72 Bitcoins on the first day, and the other hand, the price of Bitcoin further declined to break the support levels of $9,800. Bitcoin is not the only cryptocurrency that declined; a downward correction was seen in all the other cryptocurrencies as well.
This decline has left the crypto market red as the prices are testing the support levels of the coins while the resistances keep changing.
Currently, Bitcoin is trading at $9,696.90 as the price continues the bearish trends in the chart. Strong resistance can be seen near $9,780 level as the price is trying to push towards it. Immediate support if forming near the $9,520 level as the price keeps testing the $9,600 support level.
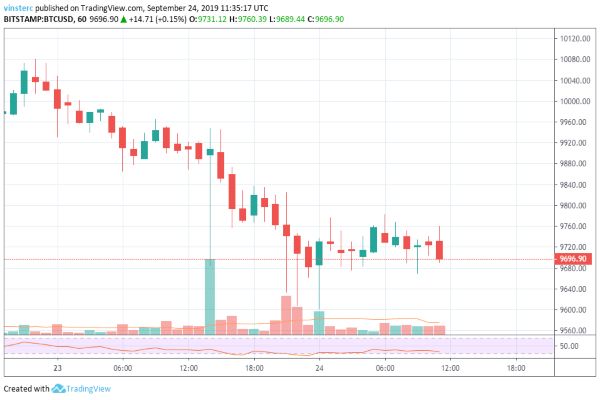
A further decline in the price will take it to test the support levels present at $9,400 and $9,300 levels. A bullish trend in the market will push the price towards the resistance levels of $9,800, and if the trade closes around $9,800 level, an upward trend can be expected in price towards the major resistance at $9,950 and $10,000 levels.
ETH/USD
After testing the month’s high position of $224, Ethereum is declining quickly as the price broke the support level of $200 and went all the way down towards the $196 levels. This has put ETH under a lot of pressure as the price is likely to go lower.
Currently, Ethereum is trading at $197.49 after facing a decline of 3.87% from yesterday. Strong resistance can be seen near the $198.50 level as the price tries to gain a bullish trend. Immediate support is forming near the $194 levels as the price is struggling to maintain an upward trend in the charts.
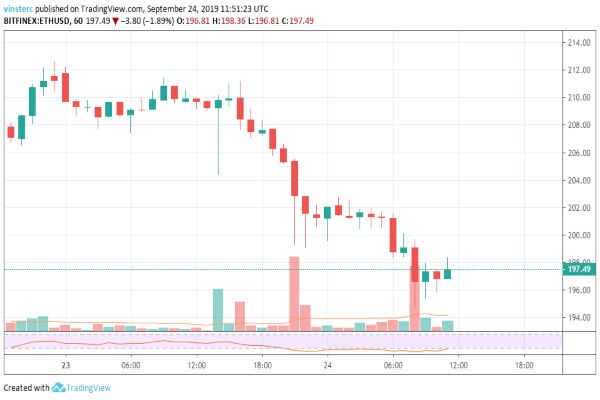
In case the price goes up, we can expect the price to move towards the resistance level of $202 and further upward moment will take it to the major resistance levels of $208 and $210. In case the downward correction continues, we can expect the price to go down and test the support levels of $194. Any further decline will take price towards the $192 $190 support levels.
XRP/USD
Ripple has continued its downward trend as the price goes further down to test the support levels of $0.2650 and $0.2620. The price is facing strong decline trend which can be seen forming in the charts as the price fails to go upwards.
Currently, XRP is trading at $0.2685 with a strong resistance forming near the $0.2730 level, and immediate support forming near the $0.2650 and $0.2620 levels. In case of a bullish trend, we can expect the price to go upwards and head for the resistance levels of $0.2730 and further aim for the major resistance at $0.2800 and $0.2850.
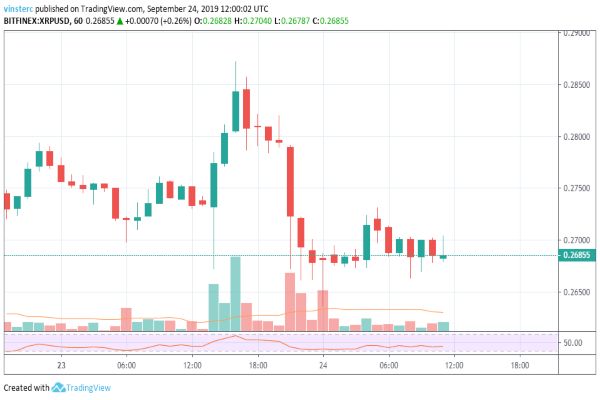
In case a bearish trend continues, which is more likely to happen if the price goes below $0.2650, we can expect the price to head towards the support level of $0.2600. The further decline will make the price test the support levels at $0.2550 and $0.2500.
LTC/USD
Litecoin spent the last week with the bulls as the price tested the resistance level of $80, but it didn’t last long as a slow decline started in the price. This decline in price was not supported well, and the price went further down, testing the support levels on its way.
Currently, LTC is trading at $66.52 as a further decline can be seen in the charts that may occur in the future. Strong resistance can be seen, forming near the $67.50 level as the price fails to form a bullish trend in the chart. Immediate support is present at $65.50 level.
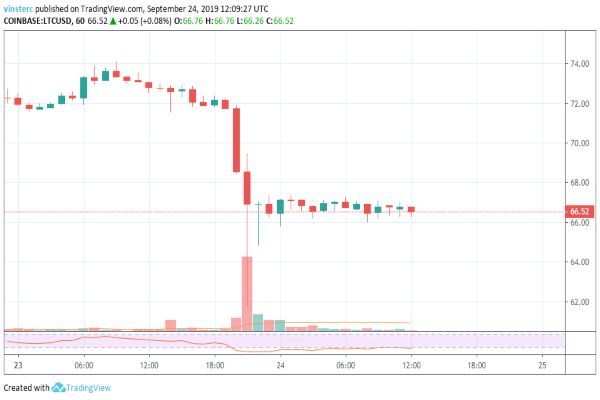
In case the downward correction continues, we can expect the price to head towards the support levels of $65.50 and $64.50. A further decline in the price will make LTC test the support levels of $64 and $62.
BCH/USD
Bitcoin Cash is facing the market gravity the most as the price goes from $308 levels to trading below $290 in a matter of 24 hours. The support level of $300 has been broken as the price continued to test further below.
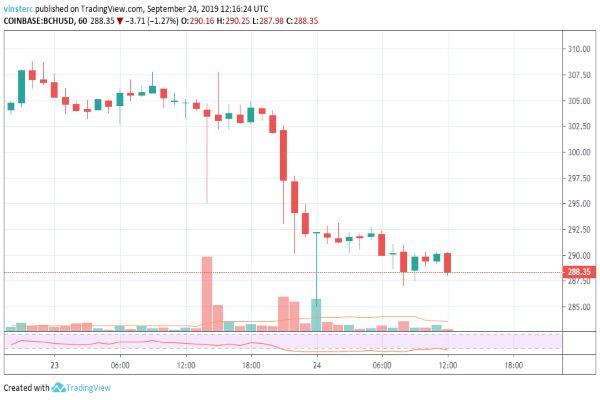
Currently, BCH is trading at $288.35 as the price continues the downward trend in the price. Immediate support for BCH can be seen near $285 as it faces a strong resistance near $295 level. In case the downward trend continues, we can expect the price to test the support levels of $285 and go further towards the $282 and $280 levels.
A bullish trend in the market will push the price towards the resistance level of $295, and a breakthrough will take the price towards the critical resistance levels of $305 and $310.


