

BTCUSD Outlook: Bearish
Financial Markets around the world are going through a jittery phase. The Coronavirus pandemic has hit the markets hard. Amidst these times of uncertainty, investors globally prefer assets that ensure the safety of the invested capital. Bitcoin and other cryptocurrencies have experienced massive sell-offs in the past few weeks.
Formation of the Death Cross: Bearish Outlook
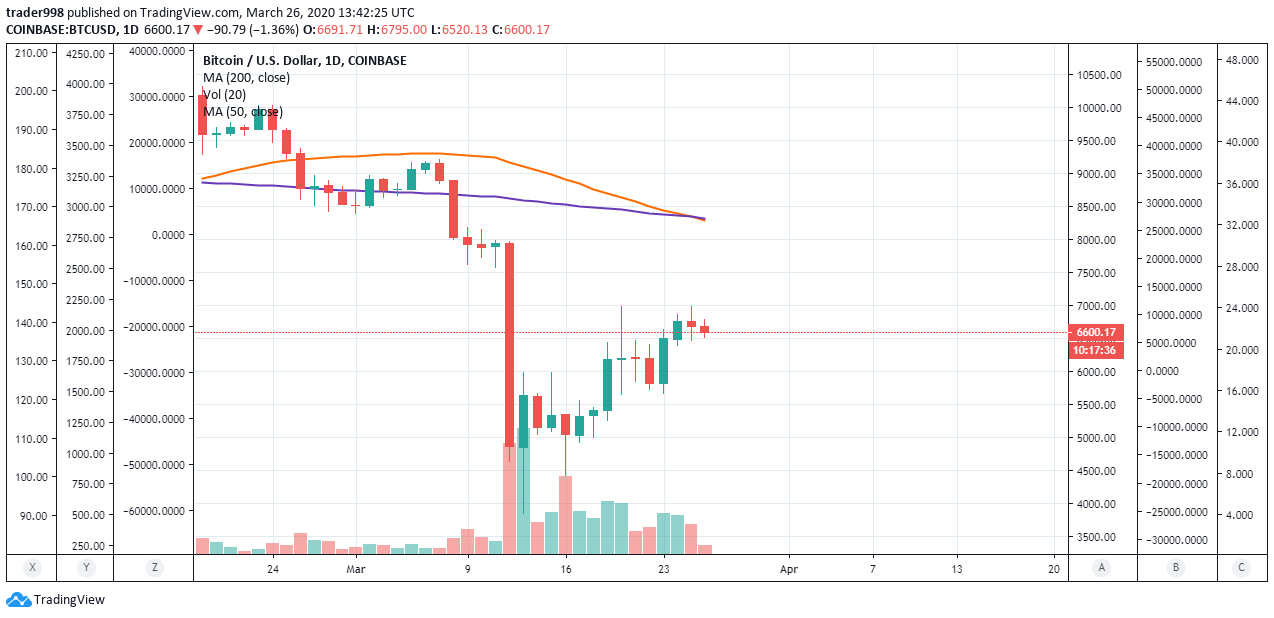
The BTCUSD candlesticks formed a Death Cross pattern on March 25.
A Death Cross pattern forms when the shorter-term moving average, such as the 50 DMA, crosses down the longer-term moving average, which is the 200 DMA. The Death Cross is usually a confirmation pattern for a long term Bearish stage. The 200 DMA will act as the new resistance.
- Now, this is significant is because a Death Cross accompanied by a high volume has almost always been an accurate indicator predicting the stock market crisis of 1929, 2008, and many others.
- However, it is not sacrosanct. On some occasions, the Death Cross has been a false indicator. It remains to be seen whether the price breaks the resistance level of US $6,900 along with the volume levels.
Low Volumes of BTCUSD indicating a weak Upside
- Bitcoin’s price rose from its month’s low of $4845.51 to $5,637 on March 13. Since then, BTC has shown somewhat of upward momentum. However, this movement was not accompanied by an increase in volume, suggesting speculation among investors regarding the US Government’s bailout package. Low volumes further indicate a Bearish phase.btcusd
- The price of Bitcoin reached a daily close of US $6,731 on March 24. It continued to increase for a short period the next day. The BTCUSD started falling after hitting the resistance level of $5,900 and the 0.382 Fibonacci level. Now, it would have been significant had it broken this resistance level. However, it didn’t and instead formed a bearish Doji.
At the time of writing this article, the BTCUSD candlesticks followed a sideways pattern hovering around the price point of $6,640. Now, all of these lead to a Bearish outlook in the long term. It, however, remains to be seen what happens to the Coronavirus pandemic as this might ultimately bring a much needed positive momentum for this cryptocurrency.


