

Technical Indicators:
Support Levels: $6400, $6200, $6000
Resistance Levels: $6550, $6600, $6800-6850
Key Points:
- Bitcoin price started a fresh bull run and broke above $6400 resistance level.
- As discussed yesterday, Bitcoin price tested the $6500 resistance level and was able to break above this range as well.
- The bullish pattern line which was being formed on the hourly chart yesterday with resistance around $6050 is still on the chart.
- Currently, the overall momentum seems bullish, however, a major bear attack is all set to appear around $6800-6850 resistance level.
Bitcoin Price Analysis:
SUMMARY: Bitcoin price was able to break above $6400 and $6500 resistance levels. BTC is currently trading with a bullish force but might soon face the major bear attack around $6800.
Bitcoin price broke above the $6200 resistance level yesterday. The buyers were able to push the price even above the 100 hourly SMA and the $6350 level. Due to this, the bulls were able to take full charge and cleared the critical resistance around $6400. Bitcoin price soon tested the $6500 level too, however, it started consolidating gains.
After correcting a few points downwards, the bulls gained momentum again and this time with full force were able to push bitcoin price above $6500 resistance level. Currently, BTC is well settled above this level and facing resistance around $6550-6600 level. The current support for bitcoin price is at $6400 below which it might test $6250 and $6000 levels.
The bullish pattern line that was being formed on the hourly chart yesterday with support around $6050 is still on the same chart. Currently, Bitcoin price is trying to break above $6550-6600 resistance level above which it might test the most major long term resistance around $6800. BTC might fall back downwards after testing this level as a lot of large sellers are placed around this range.
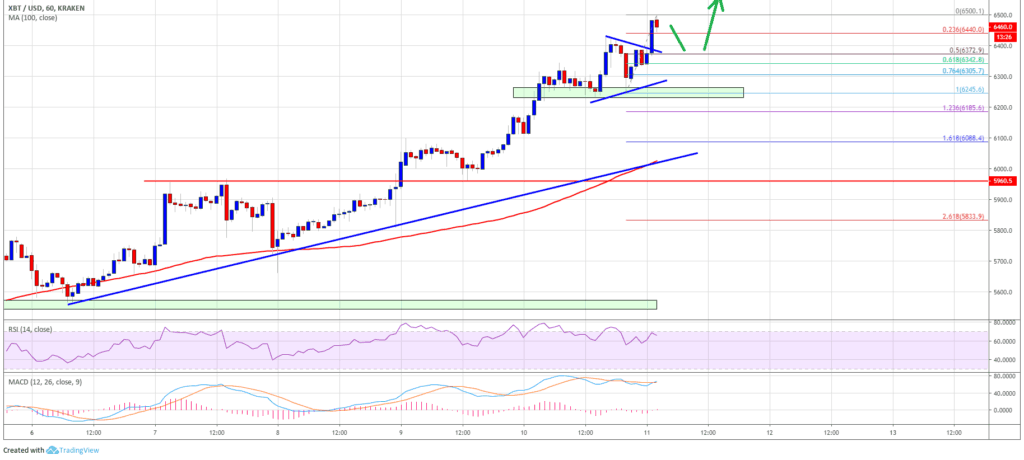
The chart shows that BTC is gaining momentum above $6500. It could correct downwards, however, currently it is well supported around $6400 and $6200. On the upside, bitcoin price might soon test the most major resistance level around $6800 where a bear attack might lead to the price crashing back below $6000 level and the 100 hourly SMA.


