

Technical Indicators:
Support Level: $5600
Resistance Levels: $5700, $5850
Key Points:
- Bitcoin price started a downward correction after rising over $5800 resistance level recently.
- BTC declined beneath the $5700 and $5600 support levels, however, it found decent support around $5580 which stopped further losses.
- A bullish pattern is being formed with support around $5600 on the hourly chart.
- Bitcoin price will most likely break above $5700 resistance in the short term.
Bitcoin Price Analysis:
Summary: Bitcoin price is currently supported well above $5500. BTC will most likely start a fresh bull run and break above $5700 and $5800 resistance levels in the short term if the bulls remain in action.
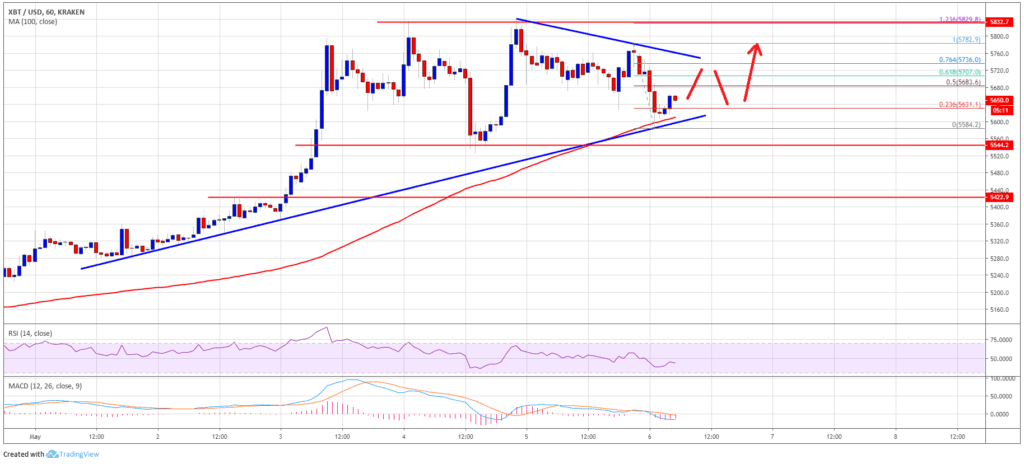
There was a sharp surge in the price of bitcoin last week as it broke above $5700 resistance level. BTC was also able to break above $5800 resistance level and settle above the 100 hourly SMA. A new yearly high was formed around $5840 after which BTC started a downward correction. The selling pressure increased and the bitcoin price fell below $5700 and $5600 support levels. However, the support around $5580 proved strong enough to stop any further losses.
Currently, bitcoin price is trading well above $5600 and the 100 hourly SMA. A bullish pattern is also being formed with support around $5600 on the hourly chart. Minor resistance is formed between $5680 and $5700, however, the major resistance lies around $5760. If Bitcoin price is able to break through and close above this range, there are chances that BTC might spike upwards above $5800 and $5850 resistance levels in the short term and move towards $6000.
The major support for BTC lies around $5600 and the 100 hourly SMA. If Bitcoin price falls below this range, the momentum might turn bearish and BTC might move towards testing the $5500 and $5400 support levels. Any further declines can also lead to bitcoin price crashing towards $5200 and $5100 in the short term.
The chart shows that BTC is currently trading in a positive zone above the $5600 support level. As long as bitcoin remains above this range, it might rise over the $5700 and $5800 resistance levels. If the bulls are able to regain the force, bitcoin might break over the $5850 resistance level to test $6000.


