

Technical Indicators:
Support Level: $6000
Resistance Levels: $6080-$6100, $6200, $6500
Key Points:
- The bitcoin bulls gained strength and BTC traded to a new yearly high around $6080.
- BTC price tested the $6100 resistance level, however, it started a downward correction later.
- Bitcoin price was able to break and settle well above the bearish pattern line which was being formed with resistance around $6000 on the hourly chart.
- BTC has gathered a lot of support on the downside around $6000 and might soon move towards testing the $6100 and $6200 resistance levels.
Bitcoin Price Analysis:
SUMMARY: Bitcoin price is currently trading with a bullish momentum rising above the $6000 level which has now turned into major support. BTC could soon test the $6200 resistance level before an upward or downward move occurs.
Bitcoin price declined sharply yesterday after the news of the Binance exchange hack spread across the crypto space. BTC fell below the $5900 & $5800 support levels and even settled below the 100 hourly SMA. The support around $5560 proved strong enough to stop further losses and a lot of buyers emerged around this level and pushed the price upwards.
The bull run started after Bitcoin price broke above the $5900 resistance level. BTC soon moved over the $5950 and the 100 hourly SMA. Bitcoin price was also able to break through the bearish pattern line which was being formed with resistance around $6000 on the hourly chart yesterday. The bulls moved BTC to a new yearly high around $6100, where the selling started and BTC started to correct downwards.
Bitcoin price recorded a new yearly high at $6096 and is currently correcting downwards. However, BTC remains well supported on the downside at $6020 and $6000 levels. If BTC price moves below this support range, the next support lies around $5950 and $5900. However, the overall momentum seems quite bullish and a bullish pattern line is also being formed on the hourly chart with support around $5880 in case BTC corrects downwards. The current resistance lies around $6080-6100 and $6200 levels above which Bitcoin price might test the $6200 and $6500 levels.
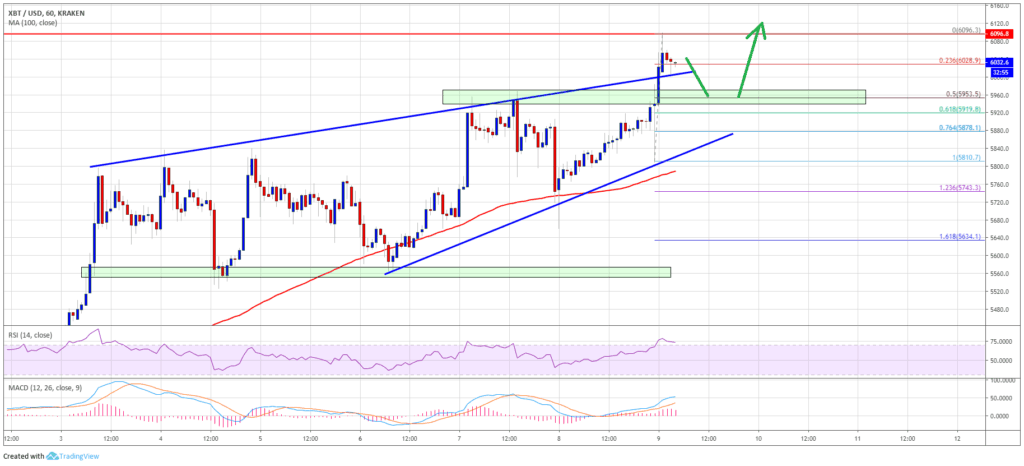
The chart shows that Bitcoin price is trading in a strong bullish momentum above the $5950 and $6000 support levels. There are chances that the Bitcoin price might start a downward correction after testing the $6100 and $6200 resistance levels. If BTC is able to break above these resistance levels, it might soon test the $6500 resistance level.


