

Technical Indicators:
Support Levels: $5750, $5600
Resistance Level: $5850, $5900 and $5950-$6000
Key Points:
- Bitcoin price surged to a new yearly high around $5965 before correcting downwards.
- The selling pressure increased and BTC moved below $5900 and $5850 support levels.
- Bitcoin price broke below the bullish pattern which was being formed on the hourly chart yesterday with support around $5850.
- There are chances that BTC price might soon test the $5900 resistance level.
Bitcoin Price Analysis:
SUMMARY: Bitcoin price started to correct downwards after moving to a new yearly high above $5950 resistance level. BTC is currently supported well on the downside, around $5750 and $5600.
Bitcoin price moved over the $5850 resistance level yesterday and even broke above the $5900, $5950 resistance levels. It tested the resistance around $6000 creating a new yearly high around $5965 before correcting downwards. The selling pressure increased after the news of Binance Hack which led to 7000 BTC being stolen flashed all over the cryptocurrency space.
BTC price soon crashed below $5800 support level and broke below the bullish pattern which was being formed on the hourly chart yesterday with support around $5850. BTC moved below the $5700 level and the 100 hourly SMA. The bulls were able to take their positions soon and moved the price above $5750 resistance and the 100 hourly SMA.
The current resistance lies around $5850 and BTC might soon move over this level in order to test the $5900 resistance level. If the Bitcoin price is able to break above this level, it might soon retest the resistance between $5950 and $6000. The initial support for bitcoin currently lies around $5760, however, the major support lies at $5750 and $5600 levels.
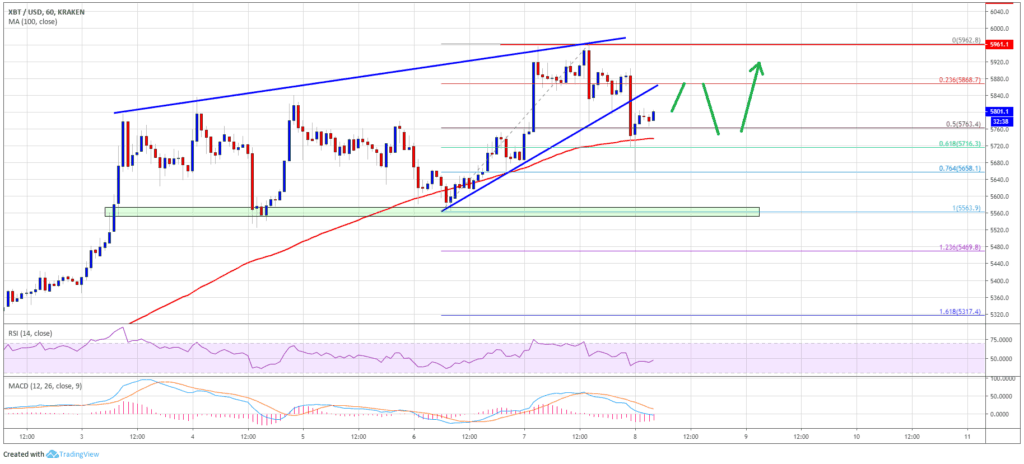
The chart shows that the bitcoin price crashed downwards after testing the $5950-6000 resistance level and the news of the binance hack. However, the bulls have successfully gained momentum again and BTC might soon move ahead in order to test the $5900 and $5950-6000 resistance levels.


