

Technical Indicators:
Support Level: $6000
Resistance Level: $6300
Key Points:
- Bitcoin price surged massively and broke above the $6200 resistance level.
- BTC was even able to break above the $6300 resistance levels and now aiming for $6500.
- A bullish pattern line is being formed with current support at around $6000-6050 on the hourly chart.
- BTC might correct downwards towards $6000-6050 level soon.
Bitcoin Price Analysis:
SUMMARY: Bitcoin price surged more than 4% yesterday and moved over the $6200 and $6300 resistance levels before correcting downwards. BTC is currently trading in positive momentum, however, a correction towards $6000-6050 is likely before it can aim for $6500 level.
The current week was quite bullish for bitcoin price as it was able to rise above the major resistance levels that were $6000, $6200 and $6300. The bulls gained pace after breaking above $6100 level and the 100 hourly SMA. The buyers were able to push the price above $6200 and $6300 resistance levels, recording a new yearly high at around $6314. However, a lot of sellers emerged around this level and bitcoin price started to correct downwards below $6300 level.
Minor support lies around $6200 below which BTC might test $6050-6000 level again. There is a bullish pattern line being formed around this support level. However, if bitcoin price falls below this range, it might extend losses to test $5950 and $5800 levels again. The support around $6000-6050 seems quite strong and might be able to stop further losses.
Current, Bitcoin is in a bullish momentum above the $6000 support level and the 100 hourly SMA. On the upside, however, a lot of hurdles have appeared around $6300, $6350, $6400 and $6500 which might push the price back downwards.
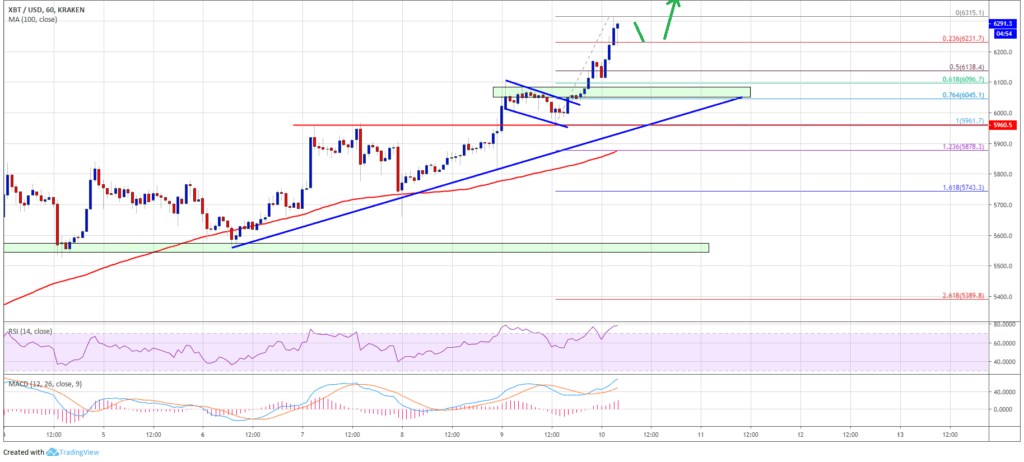
The chart shows that bitcoin price is currently trading in a positive momentum over $6200 with the current support at $6000 level. BTC could soon test the $6300 and $6400 resistance levels, however, there might be bearish moves in the short term which might push the price back towards $6000 and $5900 levels.


