

Dominant bias for Bitcoin (BTC)–Ranging
Resistance Levels- $6800, $6900, $7000
Support Levels- $6000, $5900. $5800
BTC continues in a range-bound market. The strong bearish pressure within the range was lost on 20th October after the formation of a bullish spinning top at $6524. The bulls manage a push of BTCUSD to $6660 in the resistance area before exhaustion sets in as the candle closes with a wick on 21st October. The bears’ takeover s further confirmed by the bearish railroad form at $6642 same day.
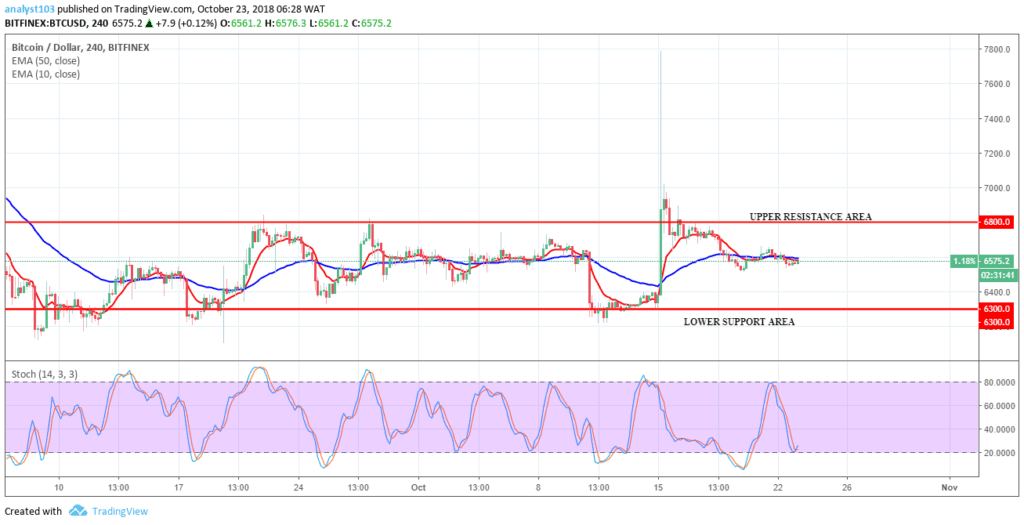
BTCUSD was down to $6538 in the support area on 22nd October while the bulls show sign of gradual return within the range as bullish candles were been formed.
The stochastic oscillator is in the oversold region at 23% but its signal points up which implies upward price movement within the range may occur.
BTCUSD is in consolidation and trading between $6800 in the upper resistance area and at $6300 in the lower support area of the range. A breakout at the upper area will be good for a long while a breakdown at the lower area suggests shorting the cryptocurrency, but it will be a good strategy to wait for either to occur before taking a position.


