

- The day’s range for Bitcoin remained at $7,000.67 — $7,157.50.
- With the improvement in the US stock markets, Bitcoin remained bullish in the short term. The long term outlook, however, continues to remain bearish for the BTC.
Let’s take a closer look at the BTCUSD technicals
Short Term analysis of Bitcoin trading:
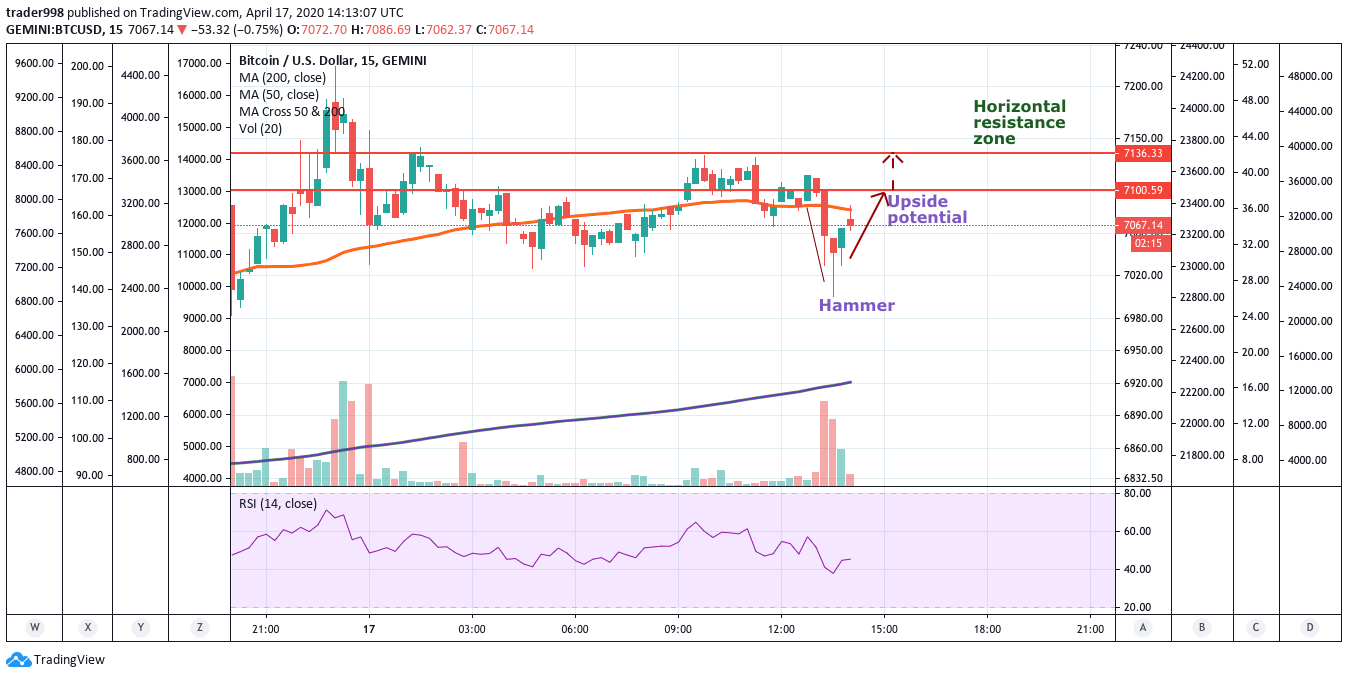
BTCUSD Chart Published on TradingView.com
- Here’s is the fifteen-minute chart for BTC. It shows the formation of a ‘Hammer‘ at the end of a downtrend. It is a strong Bullish indicator. The upside could be till $7100.59, and the second target could be $7136.33. Entering the trade at $7,045 would have given an almost 7% return within four trading sessions.
- In the short term, the MACD Indicator also gives a ‘Buy’ signal for Bitcoin. Relative Strength Index or RSI is, however, neutral at this point of time
BTC long term outlook still bearish
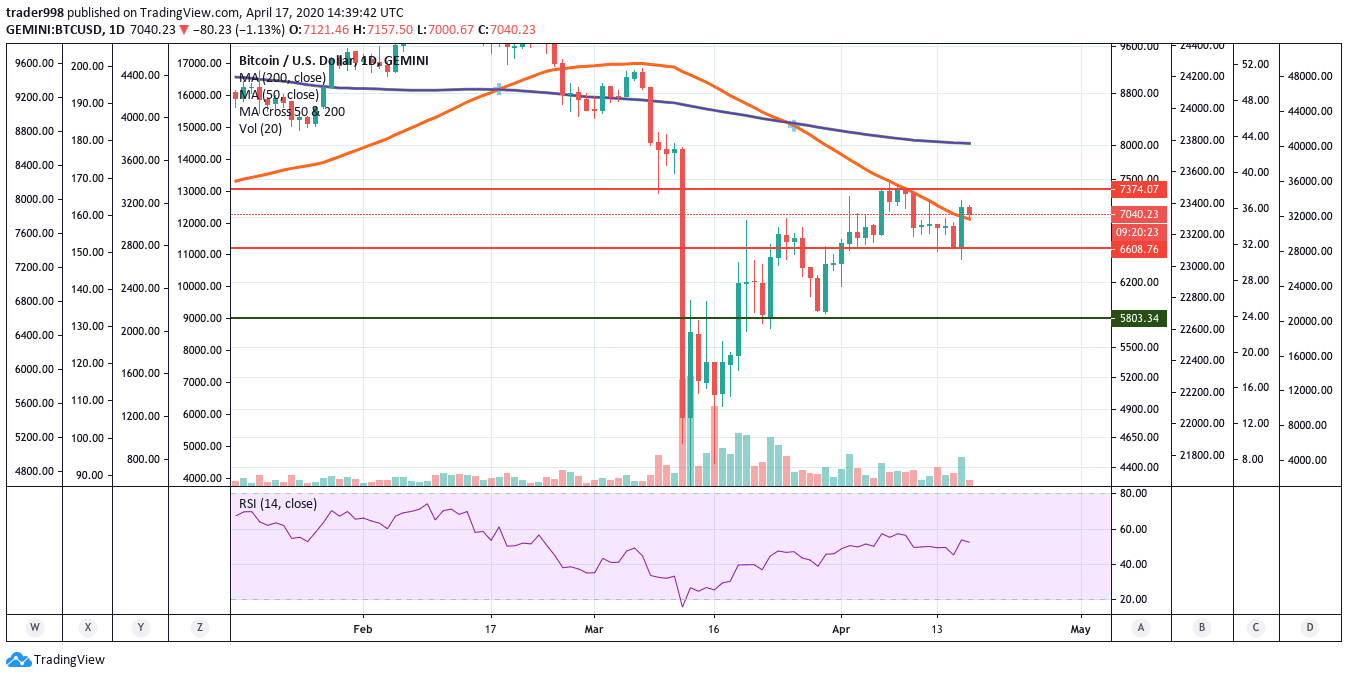
BTCUSD Chart Published on TradingView.com
- Bitcoin’s long term outlook continues to remain bearish. The daily chart indicates Bitcoin prices moving in a constant horizontal channel. The support is at $6,608.76. Breaking below this support zone, the next support for BTC lies at $5,803.
- Bitcoin’s weekly chart provides a grim picture, as well. The Bear flag that Bitcoin formed could break out any moment soon. In that case, BTCUSD might drop to $4,000.
The bottom line is Bitcoin traders could look at strong indications and place a trade on Bitcoin in the short term, and book profits accordingly. In the long run, Bitcoin might not be the best of investments right now. A steep price decline would take place, following which prices would stabilize, and that would be the correct time to buy Bitcoins.


