

Technical Indicators:
Support Level: $3940
Resistance Levels: $4000, $4040
Key Points:
- Bitcoin price traded in a positive momentum last weak reaching up to $4040.
- BTC corrected downwards later breaking $4000 support to test the $3940 support level.
- Bitcoin price was able to break through a bearish pattern line that was formed with resistance at $3970.
- BTC is currently correcting downwards, however, the support around $3940 is strong enough to stop losses.
Bitcoin Price Analysis:
Summary: Bitcoin price is currently correcting downwards below $4000 range. However, BTC will likely move upwards as it remains well supported above $3940.
Bitcoin price traded positively last week and moved above $4000. BTC was able to break the $4020 resistance level and tested the $4040 resistance before correcting downward. Bitcoin moved below $4000 while correcting downwards and even broke the $3980 support level.
The next support at $3940 proved strong enough to stop further losses and keep the price above the 100 hourly SMA. The price then moved over $3960 resistance and was also able to break through a bearish pattern line that was formed with resistance at $3970. BTC even moved over $4000 again but the buyers were not able to compete with the selling pressure and hence it moved below $4000 again.
Bitcoin price is currently correcting downwards, however, it remains well supported above $3940 support level. Also, the next support around $3920 and 100 hourly SMA is also strong. The current resistance lies at $4000 followed by $4040.
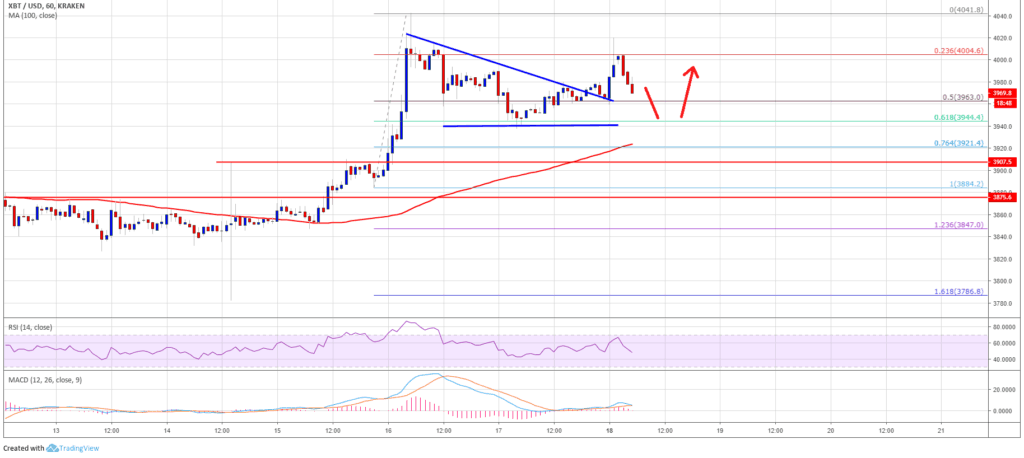
The chart shows that bitcoin price is currently trading downwards, however, it is strongly supported at $3940 and $3920. If BTC falls below $3920 support, the overall momentum might turn bearish. However, bitcoin will likely test the $4000 resistance soon where a lot of sellers are placed.


