

Technical Indicators
Significant Support Level – $3,375
Significant Resistance Level – $3,450
- Bitcoin price fell to a monthly low towards $3,340 and later recovered.
- A resistance is formed close to $3,450 on the hourly chart of the BTC/USD pair.
- The price may begin a recovery back above $3500 if there is a break above $3,450.
Bitcoin price fell to a yearly low and later recovered against the US Dollar. BTC could fall further if the buyers fail to break the resistance around $3,450.
Bitcoin Price Analysis
Recently, we saw a noteworthy decrease in bitcoin price beneath the $3,400 support against the US Dollar. The BTC/USD pair exchanged beneath the $3,360 support and shaped another yearly low at $3,344. Afterward, there was a new upside recovery over the $3,380 and $3,400 levels. A buying pressure helped in the recovery of the price over the $3,420 level, yet there is a solid resistance shaped close to the $3,450 level.
Additionally, yesterday’s key bearish pattern line has formed a resistance close to $3,450 on the hourly chart of the BTC/USD pair. A break over the pattern line and resistance around $3,450 is must for further gains. The major resistance is close to $3,500. If buyers are unable to pick up strength above $3,450 and $3,480, bitcoin price can fall further below $3400.
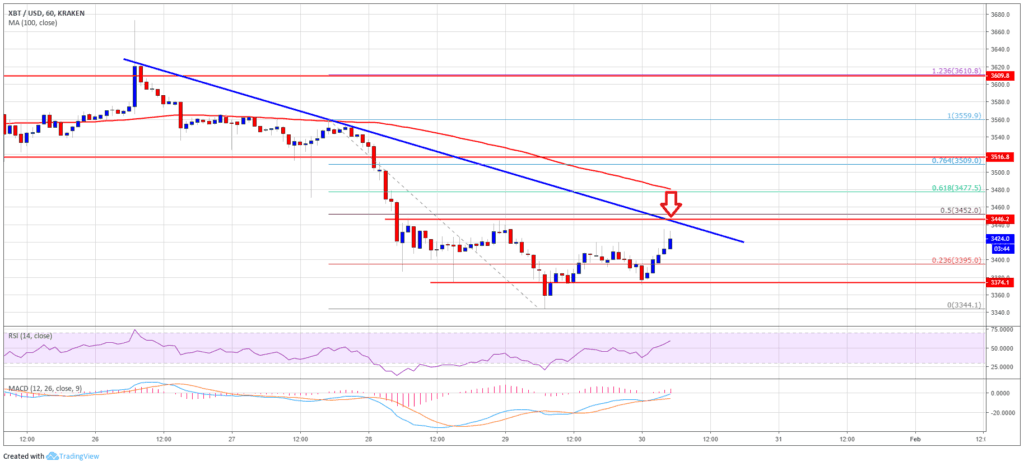
Taking a gander at the chart, bitcoin price is moving toward the key $3,450 resistance. The major support is at $3,375. If this support is broken, the price may fall below to $3,300 range.


