

General Introduction:
As soon as Bitcoin (BTC) began to accumulate, the crypto market began to weaken. Last week, the main cryptocurrency lost about 15% from its local peak ($ 9,100).
Bitcoin Price: Dominant Trend is Ranging
Resistance Levels: $8800, $9300, $9800
Support Levels: $6800, $6300, $5800
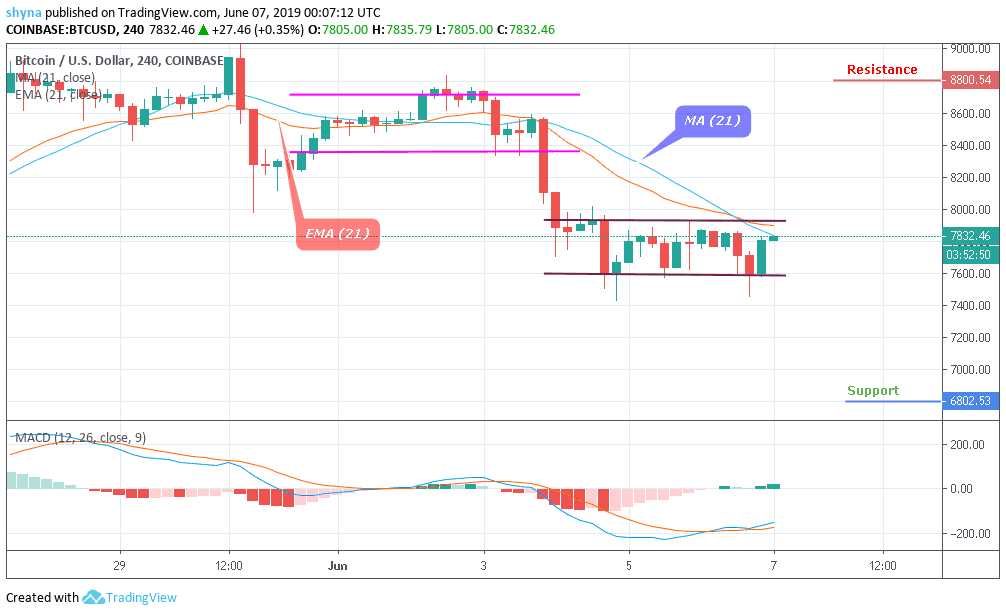
Since the fall of Bitcoin on Tuesday this week, the pressure on sales has largely faded, and BTC has found an appearance of local support in and around $7,700. In fact, this immersion may not last long and present investors, especially those who seek to embark on the cryptocurrency, an ideal opportunity to accumulate in the long term. Last week, BTC finally showed signs of insanity, as shown in the chart. It has gone under a downward channel and a medium-term trend line. It has exceeded double by around $9,000 and has not been able to close the daily candles above the always important resistances $8,800 and $9,800.
As for the 4-hour chart, BTC/USD has remained in a range of general calm and should be dancing between a range with a lower limit of $7,600 and an upper limit of $8,000. Meanwhile, the crypto exchanges the largest number of hands at $7,800 at the time of writing, its upward potential is immediately limited by MA 21. The rising moving average between 21 MA and 9 EMA indicates that sellers are not ready to make way for the market to the crushed bulls. In addition, the RSI 14 evolves laterally close to the average to show that the path of least resistance is lateral, at least for the moment. If the price exceeds the upper limit of the channel to maintain the upward trend and reach the target resistance levels at $8,800, $9,300 and $ 9,800, otherwise sellers can take control by moving it to the support levels of $6,800, $6,300 and $5,800 respectively.


