

General Introduction:
In the last few minutes, Bitcoin (BTC) has slipped, revealing an unusual attack of weakness in a massive bull trend. In fact, in the space of a few minutes, maybe seconds, Bitcoin went down from $13,800, a record of the year, to just under $12,000.
BTCUSD Dominant Trend: Bullish
Resistance Levels: $15,000, $15,200, $15,400
Support Levels: $10,000, $9,800, $9,600
The price of Bitcoin, which peaked at almost $13,900 on Wednesday, fell in the last hour to $11,331.41. The price of BTC was approximately $13,878 just before the fall, reaching $11,331 before bouncing, and a difference of approximately $2,547. Although it has risen above $12,000, the price is currently around $13,199 at the time of writing this article. Bitcoin sellers have fallen to the highest level since January 2018 and caused Coinbase terminals to rise early in the morning before the BTC/USD pair exceeded $12,500. The cryptocurrency rose to a record high of $13,878 on Wednesday before reducing the flop of $11,331 by more than $2,000 at the end of the day/early Asia. While recent highs of around $14,000 could be immediate resistance, the January 2018 top of $17,200 could be next on the bull’s radar. On the other hand, the January 20 high around $13,000 and last week’s high of almost $11,242 may attract sellers during the slowdown.
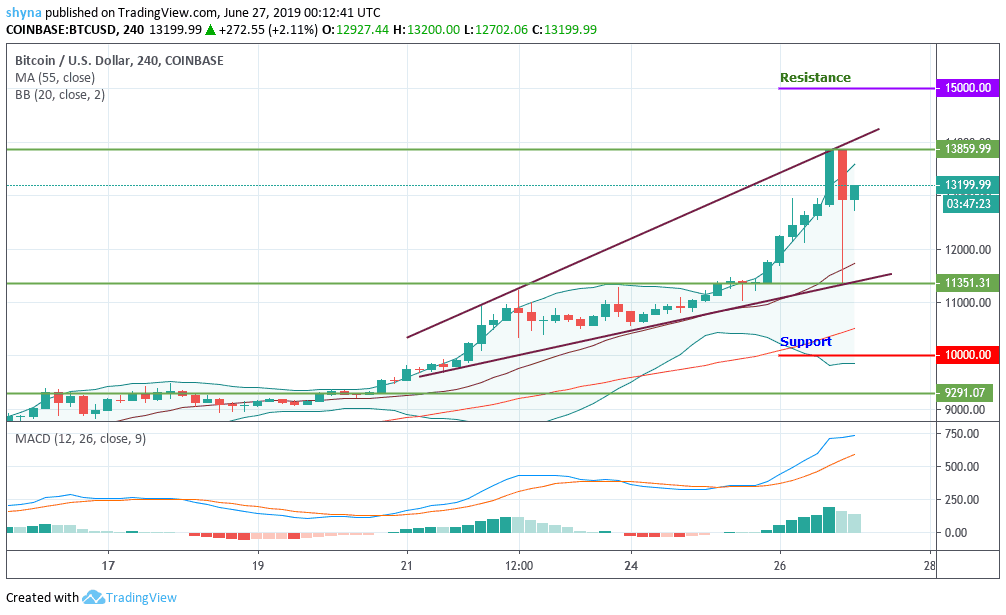
At the time of writing this report, Bitcoin had just climbed to $12,756, which represented a new high of 2019: even before the sudden fall, it’s a crazy move so far! Since he bid farewell to the $8,000 level, Bitcoin has not seen many corrections. The bulls have gained back enough momentum as the price moves northward with full force, trading above the $13,100 level after yesterday’s crash. The market price is trading above the moving average with a period of 55, which indicates an upward trend in Bitcoin and is approaching the upper limit of the Bollinger Bands indicator. The closest resistance level is the area of $13,500 to $14,000 in which we are currently located. Breaking this would probably send Bitcoin to the levels of $15,000, $15,200 and $15,400. On the downside, the possible support levels vary from $11,500 to $12,000. Below that, lies the $10,000, $9,800 and $9,600 with the MACD indicator that gives strong bullish signals to confirm the upward movement.


