

Bitcoin price has seen positive action in the last 24 hours, exceeding $11,400 mark. Most altcoins went up slightly, with some smaller cryptos recording large double-digit gains.
BTCUSD Dominant Trend: Bullish
Supply Levels: $12,500, $12,600, $12,700
Demand Levels: $9,500, $9,400, $9,300
Bitcoin Price Analysis
With the leading cryptocurrency that goes beyond diving in a five-digit territory, it is quite possible that something bigger is happening. After some ephemeral attempts to stay above $11,000 in recent days, the most popular cryptocurrency, Bitcoin, has taken another step in this area. In just a few hours, Bitcoin price has overcome the $11,500 resistance and is now showing a significant increase of $12,500, the next big resistance. Already merchants and analysts are reacting to what this might mean. Currently, the Bitcoin price has just reached $11,700 and is eyeballing $11,800. Bitcoin continues to express some optimistic technical formations and, if it manages to increase as much as it has done so far this year, its price could soon approach the region to more than $20,000. It is important to bear in mind that the recent upward rise has allowed Bitcoin price to form strong technical formations, which could help it increase its price in the coming days and weeks.
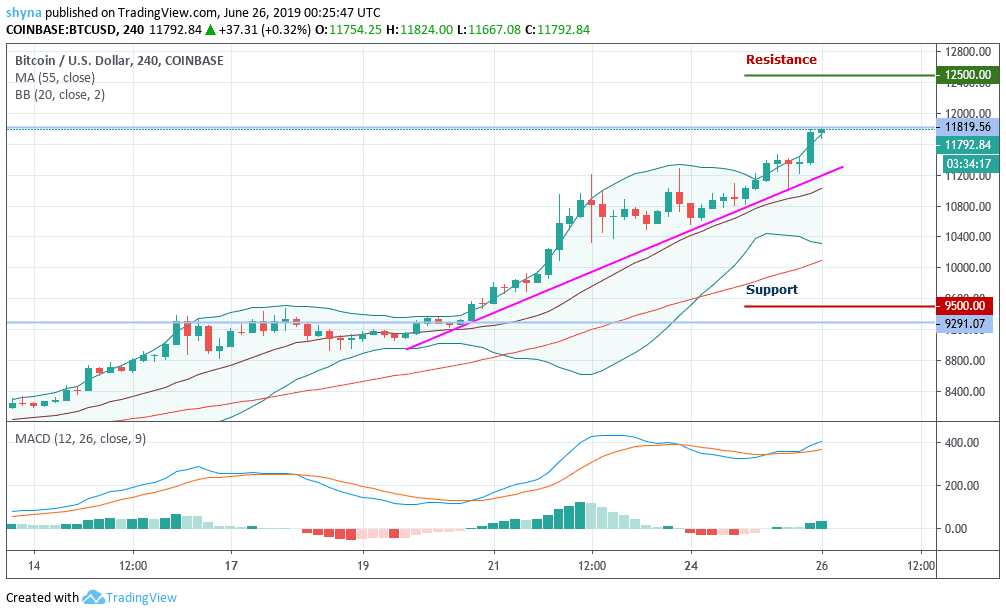
Looking at the chart, Bitcoin price is now trading at the upper limit of the Bollinger band and well above the $11,500 level and the 55-day moving average. In addition, there was a break above an ascending channel with a resistance close to $11,600 on the hourly chart of the BTC/USD pair. As a result, the price surpassed the last peak, at $11,700, reaching a new high of 2019, exceeding $11,800. The price is clearly traded with a positive bias above the levels of $11,700 and $11,750. If it continues to climb, the next stop for the bulls could be close to the $12,000 level. However, there is a good chance of an upside break above the resistance $12,500 and $12,600 levels. As a result, the price could even reach the key resistance level of $12,700 in the short term. On the downside, the initial support is close to the $9,500 level, below which Bitcoin could test the $9,400 support level. If there are more losses, the Bitcoin price could test the chain support near the $9,300 level. The MACD is currently strengthening in the bullish zone


