

Technical Indicators:
Support Level: $7600, $7500
Resistance Level: $7900-7950, $8000
Key Points:
- Bitcoin price corrected downwards and tested the $7500 level recently.
- Later, the buyers were able to push the BTC price above $7800 and $7850 resistance levels.
- Currently, a bearish pattern line is being formed on the hourly chart with resistance between $7950 and $8000 which might push the price downwards.
- There are chances that bitcoin price might soon crash towards $7700 and $7600 support levels.
Bitcoin Price Analysis:
SUMMARY: Bitcoin price was able to recover nicely after testing the $7500 support level. Currently, BTC is facing a massive amount of resistance around $7950 which might lead to another crash.
Bitcoin price started to correct downwards massively yesterday. The sellers pushed the price below $7850 support level very soon. Later, the selling pressure kept increasing and BTC soon broke below the 100 hourly SMA and $7650 level. Bitcoin price even tested the $7500 level where the buyers were able to stop further losses.
However, later, bitcoin price was able to recover nicely and broke above $7700 and $7850 resistance levels. Currently, Bitcoin is trading around $7850 level and is facing a massive amount of resistance between $7900 and $8000 level. Also, there is a major bearish pattern line being formed on the hourly chart with the resistance between $7950 and $8000 which might push the price back downwards towards the $7700 and $7600 support levels.
If the Bitcoin price is able to break and settle above the $8000 resistance level, it could soon move towards $8200 and even $8300 levels. However, until the price is below this level, there is a high risk of crash towards $7500 level below which the momentum might turn bearish.
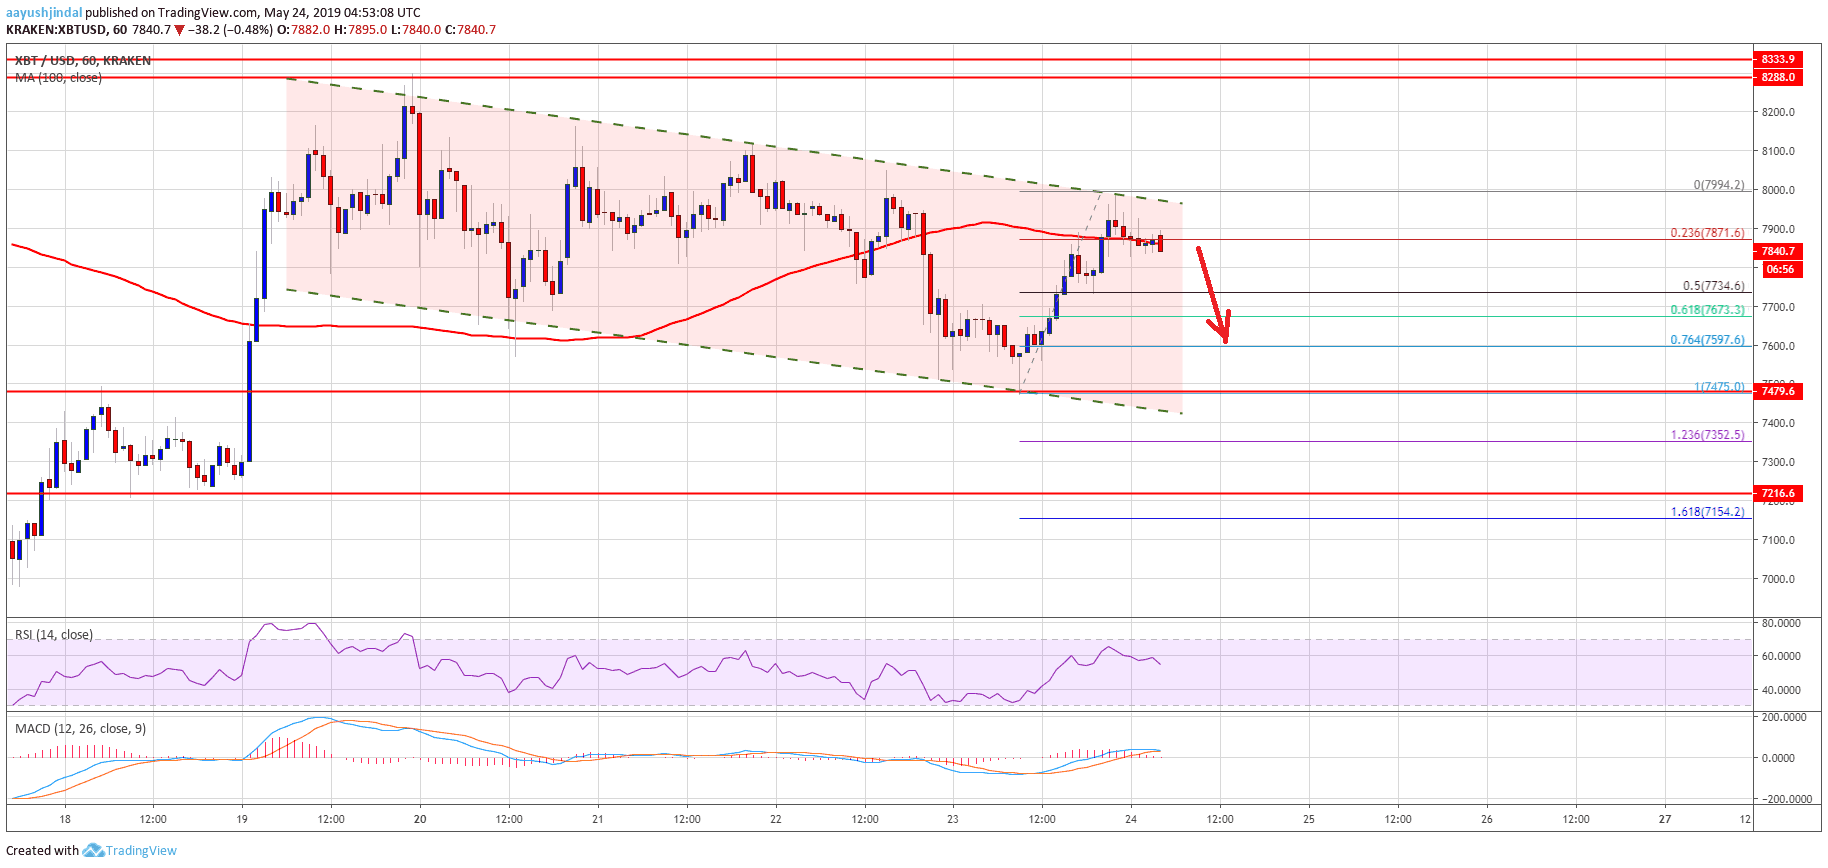
The chart shows that the bitcoin price was able to recover nicely after falling below $7500 level yesterday. However, currently, BTC is facing a lot of resistance around $7900 and $8000 which is pushing the price back downwards. BTC might soon test the $7700 and $7500 support levels before starting a fresh upside move. If bitcoin price is able to break above $8000 level, it might open doors for $8200, $8300 and even $8500 resistance levels. However, a move below $7500 can turn the overall momentum bearish.


