

Market volatility plays an important role in the financial ecosystem of assets and cryptocurrencies are regularly linked to their predominant effect. Whenever Bitcoin price showed rapid movement in the market, most critics rated the extreme volatility of the digital currency and claimed that it would eventually fall, since crypto assets cannot be used in the long term.
BTCUSD Dominant Trend: Bullish
Resistance Levels: $9800, $9900, $10000
Support Levels: $8000, $7900, $7800
Bitcoin Price Analysis
Bitcoin price, which has recovered considerably in recent months, broke a new record since the beginning of the year, surpassing the psychological level of $9,000 for the second time this year and leaving investors at the $10,000 mark. The Bitcoin and aggregate crypto markets have been able to grow significantly in the last 24 hours and Bitcoin price has now been able to consolidate its position in the $9,000 region. This bullish momentum has allowed the coin to set new highs since the beginning of the year and will likely lead it into the five-figure price region in the near future. Mere looking at the chart, one can see that Bitcoin price will probably continue to rise if it manages to stay above $8,000 demand level, but to do so, it faces a supply level of $9,800. At the time of writing this report, Bitcoin is trading about 5% at its current price of $9,100, a significant increase from the 24-hour minimum of just over $8,700.
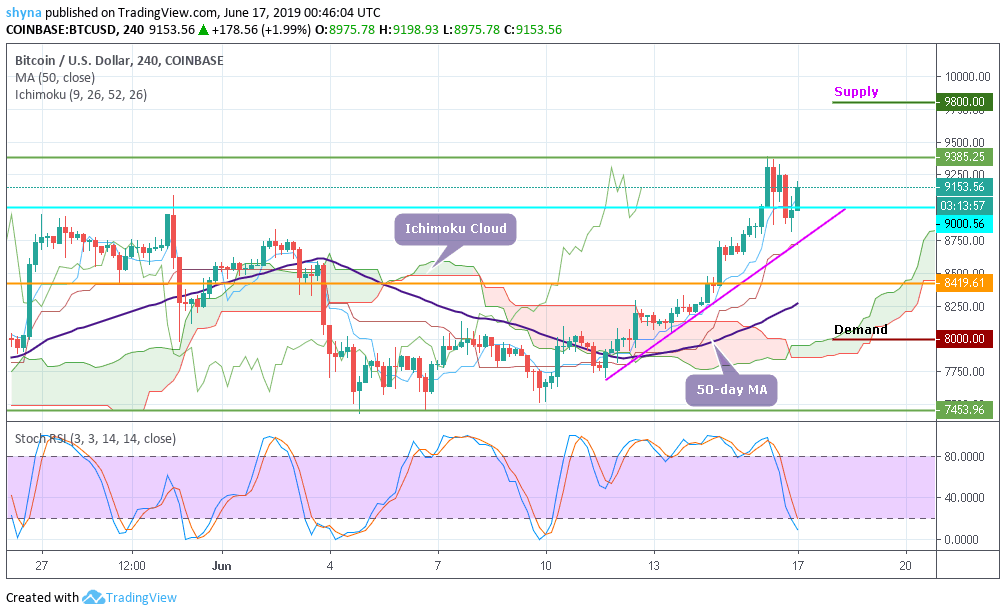
However, as Bitcoin price approaches supply $9,800 and still trading above the Ichimoku green cloud and the 50-day moving average, this momentum, which seems to be emblematic of a bull market, could lead BTC to surge significantly higher in the near future and could lead to a parabolic upward movement. Despite this, BTC/USD still faces several significant supply levels of $9,900 and $10,000, which could be very strong. For it to continue rising, it is important that the coin remains above the $8,000 demand level for its next weekly candle closure. The strong bullish trend followed by the collapse with a bullish engulfing candle helped to continue the upward trend of the last bullish cycle. The current uptrend shows similar trends. The weekly close above the demand levels above $8,000, $7,900 and $7,800 could probably indicate a continuation of the new annual highs, as the stochastic RSI is about to move into the oversold zone to reassure uptrend trading speed.


