

Currently, all top 10 coins have a fixed green color, but the highest performing coin is by far the previously reported Litecoin (LTC), reaching new annual highs today, up 10.71% at $ 126.47. Ethereum (ETH) is not far behind, with a nice rise of 5.69% to $ 244.90.
BTCUSD Dominant Trend: Bullish
Resistance Levels: $9200, $9400, $9600
Support Levels: $6800, $6600, $6400
Bitcoin Price Analysis:
In the early morning hours of Monday (June 10), Bitcoin price exploded at around $8,000 compared to a local double bottom weekend over around $7,500. The rally shocked investors and traders in the face of overly crypto expectations of a further drop in the price of the first cryptocurrency. Bitcoin price has returned to green because the main cryptocurrency is trading at $7,984, with gains of 1.50% in 24 hours. The new week started with a good note because today we have gone from $7,523 to $8,090. After falling to local levels below $7,500, Bitcoin price has now returned to visit more than $8,000 twice, indicating that the bulls are still putting up a fight. However, a break above $8,200 is required to invalidate the huge reinvestment scheme. At the time of writing, the market price was higher than the 21-day EMA red line and the upper limit of the Bollinger band indicator.
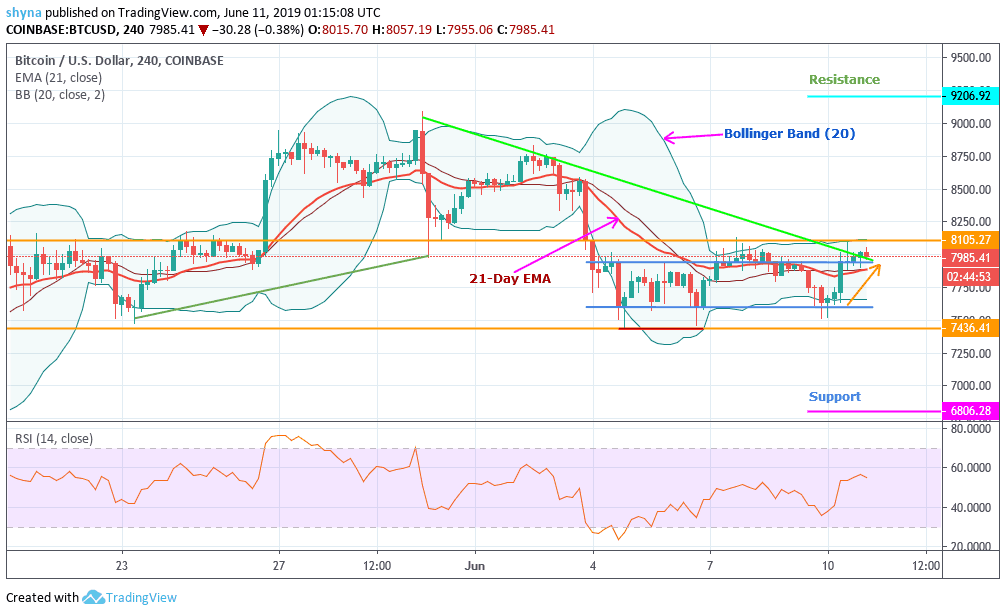
However, the main cryptocurrency by market value currently has a price of $8,040, after having reached a maximum of $8,107 yesterday. As a result, the rebound in the recovery can continue, with prices reaching $8,500 in the coming days. On the positive side, Bitcoin price could face resistance of $9,200, $9,400 and $9,600, with the upper edge of the bearish trend representing bearish highs and lows. However, the recovery may be short-lived if trade volumes remain anemic. Given an increasing relative strength index 14 in the 4-Hour chart, the bullish scenario seems quite realistic, as long as the price maintains its upward movement above $8,000. Otherwise, bearish feelings will begin to increase and attract more sellers to the market. With a support level of $6,800, we can expect more falls at the same time by touching the following support levels of $6,600 and $6,400, respectively.


