

Who would’ve thought that Bitcoin, the top cryptocurrency by market cap will be worth over $11,000 in just 6 months? Definitely not a lot of people especially when consideration is given to the $3,100 price it was wallowing in as of December 2018. Hey, that was not even the worst of it, but its 85 percent dump in price from its all-time high of $20,000 in December 2017.
So, how did it all begin? Did Bitcoin spring up by surprise? We’ll tell you what though, everyone is awed at this point because today, Bitcoin is valued at $10,900 and it has a market capitalization of $193 billion. The only way you’ll come to appreciate its current value, is knowing how far it has come. That being the case, here’s a monthly analysis of Bitcoin’s price in 2019.
January 2019
According to CoinMarketCap’s platform, Bitcoin opened at a price of $3,746.71 on January 1, 2019, but traded as high as $3,850.91 on the said date. The virtual asset also had a trading volume of $4 billion and a market capitalization of $67 billion.
Throughout the month of January, Bitcoin traded around the $3,000 price level and managed to hit $4,000 on only 4 days (between January 7 – 10). The volatility of the market was quite low since there were no significant leaps and fall in price.
Compare Bitcoin’s price on January 1, 2019, from that of today, June 24, 2019, and you’ll notice that there has been a 190.98% increment in price. Now if the same price of January 1, 2019, is compared with that of January 1, 2018 ($14,112), then it shows Bitcoin devalued by 73%.
February 2019
On February 1, 2019, Bitcoin began trading at a price of $3,460.55 and the highest for the day was $3,501.95. Its daily trading volume increased to $5 billion even though it’s market capitalization had declined to $61 billion. It is, however, worthy to note that by the end of February 2019, the daily trading volume had surged to $8 billion and the market cap returned to $67 billion as that of January.
February also holds significant since it is the month Bitcoin made its second year-to-month high of $4,200. Even though it was not significant, there was the restored hope that Bitcoin may not be going lower after all.
Similarly, the $10,000 price of today is what was evident in February 2018 where Bitcoin was trading around the same price range. Thus, a rough comparison between February 2018 and 2019 shows that Bitcoin had devalued by 65%. It also means that Bitcoin has increased by 65% since February 2019.
March 2019
Bitcoin’s opening price on March 1, 2019, was $3,853.76 and its highest price for the day was 3,907.80. The digital currency’s daily trading volume was $7 billion and it’s market capitalization was $67 billion.
While Bitcoin may have traded around $3,000 in March, it is the last time till today we’ve seen the virtual asset at that price. So, you can go ahead and call it the month of awakening.
A closer look at charts shows that Bitcoin maintained a confident stance on the $4,000 price level towards the end of March. Also, Bitcoin traded around $3,000 for only 18 days in the month of March which differs from the 26 days and 22 days in January and February 2019, respectively.
April 2019
April 2019 is when the leap we’re seeing today all began. At first, most people thought it was an April fool’s joke when Bitcoin which opened at $4,105.36 on April 1, 2019, surged to $4,905.95 on April 2, 2019. It was certainly too good to be true especially for an asset that maintained a steady movement in its price for the first three months of the year.
In terms of market capitalization, it rose from $73 billion and by the end of April 2019, Bitcoin’s market cap was comfortably sitting at $94 billion. Its poor daily trading volume of $4 billion in January spiked to $13 billion as of April’s end.
What this means is that a lot of interest was kindled once Bitcoin’s price began picking up in the April fool’s month. The interest did a lot of good for Bitcoin since a higher demand finally surged its price to the $5,000 price range for the first time since November 2018.
May 2019
When we thought April was good, May did it even better by bringing thousand dollar gains instead of hundreds witnessed between January to April 2019. Here’s what it looks like, Bitcoin moved from $5,350.91 on May 1, 2019, to $6,183.04 on May 9, 2019.
It didn’t stop there, it spiked to $7,333.00 barely 48 hours later (May 10, 2019) and took it one step further on May 13, 2019, when it finally hit $8,047.41. At this point, there was a lot of anxiety and mixed feelings that Bitcoin was oversold and a dump was just waiting to happen. Nonetheless, Bitcoin dared to dip its foot at $9,008.31 on May 30, 2019.
One can obviously point out a lot of speculation in the market at this point. For instance, Bitcoin’s daily volume surged to $20 billion and it’s market capitalization was $152 billion, almost half of its all-time high in December 2017 ($320 billion).
June 2019
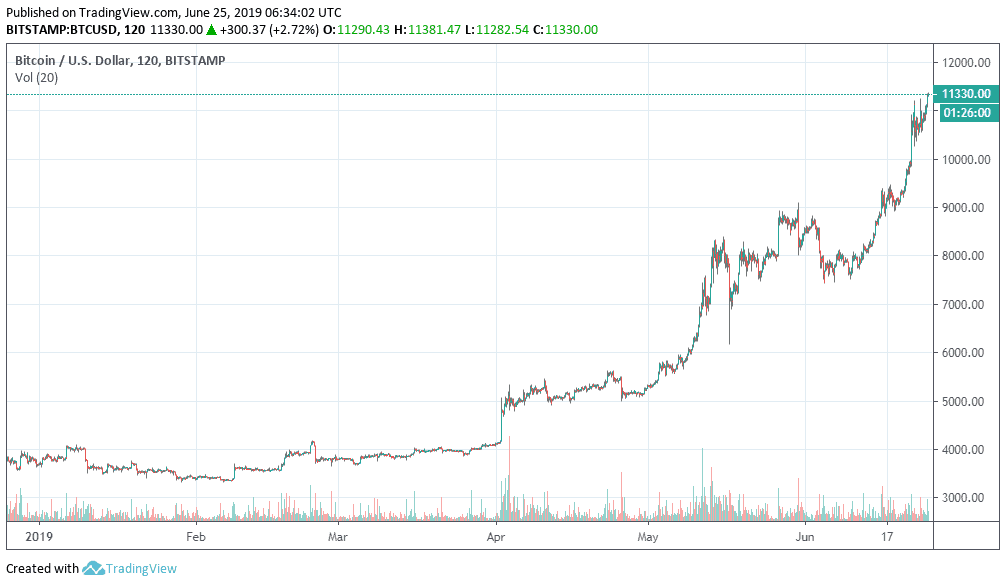
The month of June finally looked like the prediction that the market will soon correct and probably lead to severe losses will be coming true. This is because from $9,000 as of May (even though it was a flash), Bitcoin devalued to $7,400. Nonetheless, it was a reminder that one should not be quick to judge because, on Jun 23, 2019, Bitcoin hit its year to date high of $11,246.
The last time it traded around that price is February 2018 which is over a year ago. Its daily trading volume today is $20 billion and it’s market capitalization is $193 billion. In comparison with how Bitcoin began the year, there have been significant gains.


