

Bitcoin Price Analysis
MACD: Bearish Zone
Support Level: $3450
Resistance Level: $3900
Key Points
- Bitcoin price fell down massively below $4000 up to $3620.
- Bears are on attack mode with the resistance now below $4000.
- The bearish pressure and panic selling could turn up to bitcoin breaking the $3450 support easily.
Bitcoin Price Analysis
Bitcoin price experienced a slight improvement above $4300. However battling the bears above $4400, the price failed to rise above the resistance between $4400 and $4500. There was a sharp decline in bitcoin price which led to the most major support at $4000 to be broken. Bitcoin is currently trading around $3600 to $3700 and the price will likely fall down further up to $3450 where the next support lies. This support, however, may not be able to tackle the massively panic selling going on in the market and may result in the further declining of the price.
Bitcoin price is breaking its own yearly low records with the price falling up to $3620. Right now, bitcoin is trying to tackle the major selling attack and trading around $3650. Underneath the $3450 support level, there is a minor support level at $3200 and if the price falls even below this range, it could result in bitcoin reaching up to $2500 in the near future.
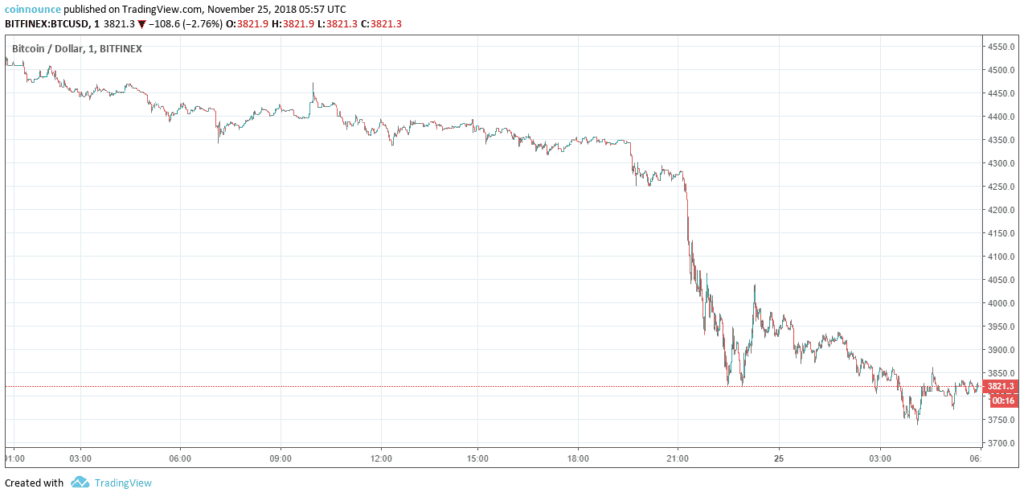
The 24-hour chart clearly shows that bitcoin is experiencing a panic selling as the $4000 support was broken. The sellers who were earlier waiting for a $5000 price are now steady at $4000. So most likely it is quite impossible for bitcoin to move above this range in the near future.
Ethereum Price Analysis
MACD: Bearish Zone
Support Level: $100
Resistance Level: $115
Key Points:
- Ethereum price is a part of the panic selling declining below $110.
- The new resistance is set at $115 with a major bear attack
- The support at $100 is quite fragile and the current panic selling will most likely break this support easily.
Ethereum Price Analysis
Once the major support at $130 was broken, Ethereum price was likely to hit $100 range as there were no major buyers between this range. The support levels at $120 and $110 were also easily broken due to the panic selling which is likely from the Initial Coin Offerings which were most likely HODLERS waiting for the ethereum to reach the moon again.
Currently, there are more than half of the ICO’s that still haven’t sold their Ethereum holdings. Once the price breaks the $100 support, these holders are likely to panic and start selling which may take the price sliding down to the next most major support at around $60. From this point, the price may start the correction again.
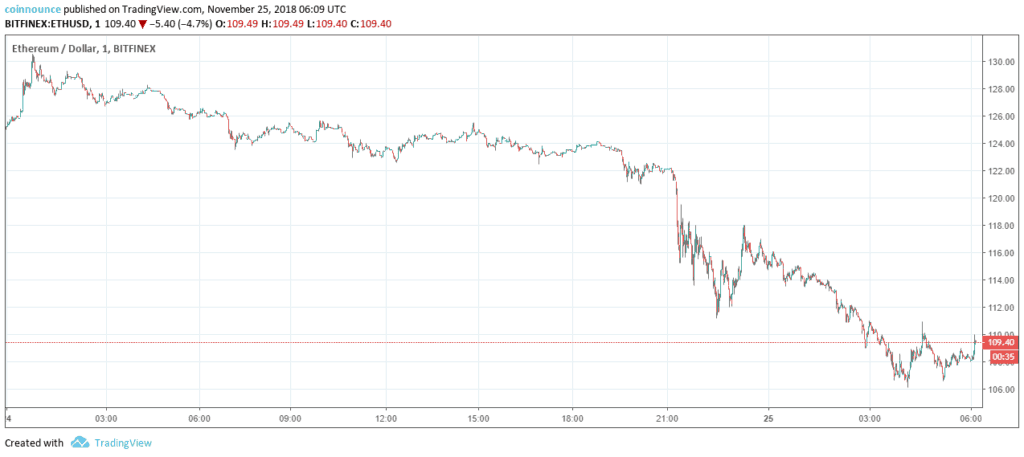
The 24-hour chart clearly indicated that Ethereum price is experiencing a huge struggle trying to tackle the bears. There is a huge chance of the coin sliding below the $100 support and start trading around $60 to $80.


