

Dominant bias for CARDANO (ADA) – Bullish
Resistance Levels- $0.08800, $0.09000, $0.09200
Support Level-$0.07000, $0.06800. $0.06600
ADA is in a bullish trend. The strong bullish pressure after the doji formation at $0.7797 in the support area signaled the bulls returned. Confirmation to the bulls’ takeover was seen as the next 4-hour candle closed as bullish engulfing above the 200EMA. ADAUSD was up $0.07963 in the support area. Increased bullish momentum led to the break of $0.08000 in the upper resistance area of yesterday analysis. $0.08154 was the high of the day as the bulls show exhaustion with a wick at the candle. A pullback to the broken area was necessary for the market correction and also a retest. These guarantee uptrend continuation as the bulls may come back much stronger.
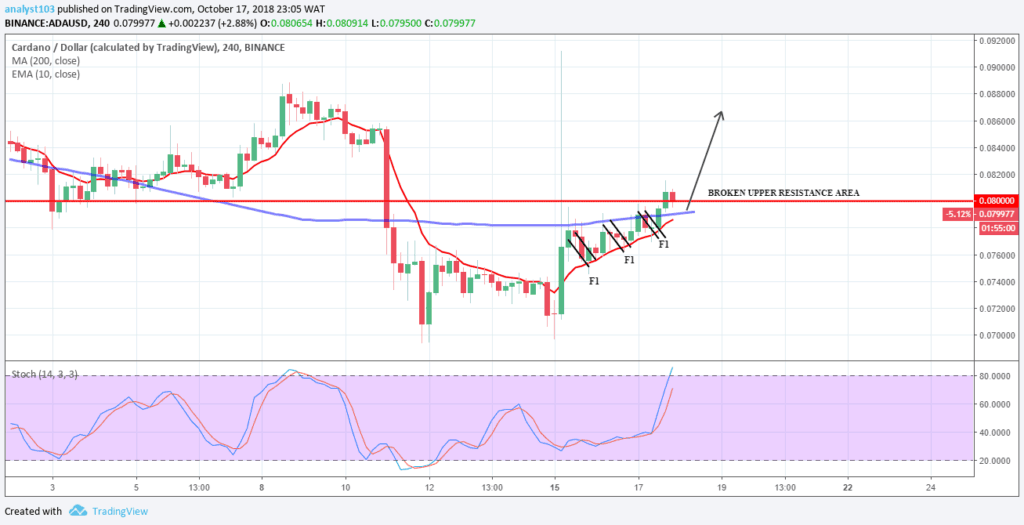
ADA Price is above the two EMAs an indication of bullish pressure with the stochastic oscillator in the overbought region at 83% and its signal points up. ADA may witness an upward price movement as the bullish momentum increase.


