

Technical Indicators:
Support Level: $130
Resistance Levels: $134, $135
Key Points:
- Ethereum price was not able to break through the resistance around $136 and $137.
- ETH fell down sharply breaking the $134 and $132 supports.
- The bearish pattern which was formed yesterday with resistance around $135 still remains on the hourly chart.
- Ethereum price is currently trading to correct upwards, however, there are a lot of sellers placed around $134 which might push the price downwards.
Ethereum Price Analysis:
Summary: Ethereum price fell down sharply against both bitcoin as well as USD. ETH is currently trying to correct upwards but will most probably face a lot of selling pressure around $134 and $135 resistance levels.
As we already knew, breaking the resistance around $137 and the 100 hourly SMA was really essential for Ethereum price in order to move upwards and stop a sudden crash. However, even after continuous attempts, ETH was not able to break through this resistance zone and hence declined sharply below the $135 support level. The downward force was strong enough to even break through $134 and $132 support levels and move the price to a weekly low of $130.
The support around $130 proved beneficial as a lot of buyers emerged at this point and moved the price above $132. There are a lot of sellers placed between $134 and $135. The previous support of $134 has now turned into strong resistance. Also, the bearish pattern which was being formed with resistance around $135 is still present on the hourly chart.
The 100 hourly SMA liest around $135, thus, Ethereum price really needs to climb up and break through the bearish pattern formation and settle above the 100 hourly SMA in order to start fresh bullish momentum. The major support lies at $130 and if ETH falls below this level, it might soon test the $125 and $122 support levels.
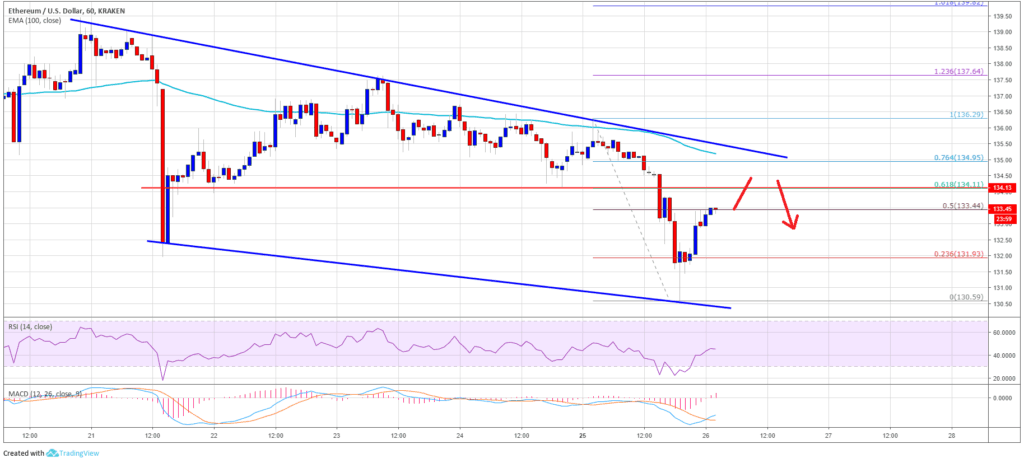
The chart shows that Ethereum price is currently trying to correct upwards, however, a lot of sellers are placed around $134 and $135. Thus, the current situation might not be termed as a buying range. If the selling pressure keeps on increasing, ETH might soon crash down towards $125.


